Database Application for Aircraft Fleet Selection
MATLAB · Excel · Decision Support Systems · ERAU
Role
Individual — Application Design & Development
Decision Support Systems · ERAU
Tools
MATLAB · MATLAB App Designer · Excel
Key Contributions
- Built a MATLAB GUI enabling airline operators to search, filter, and compare aircraft across key performance parameters
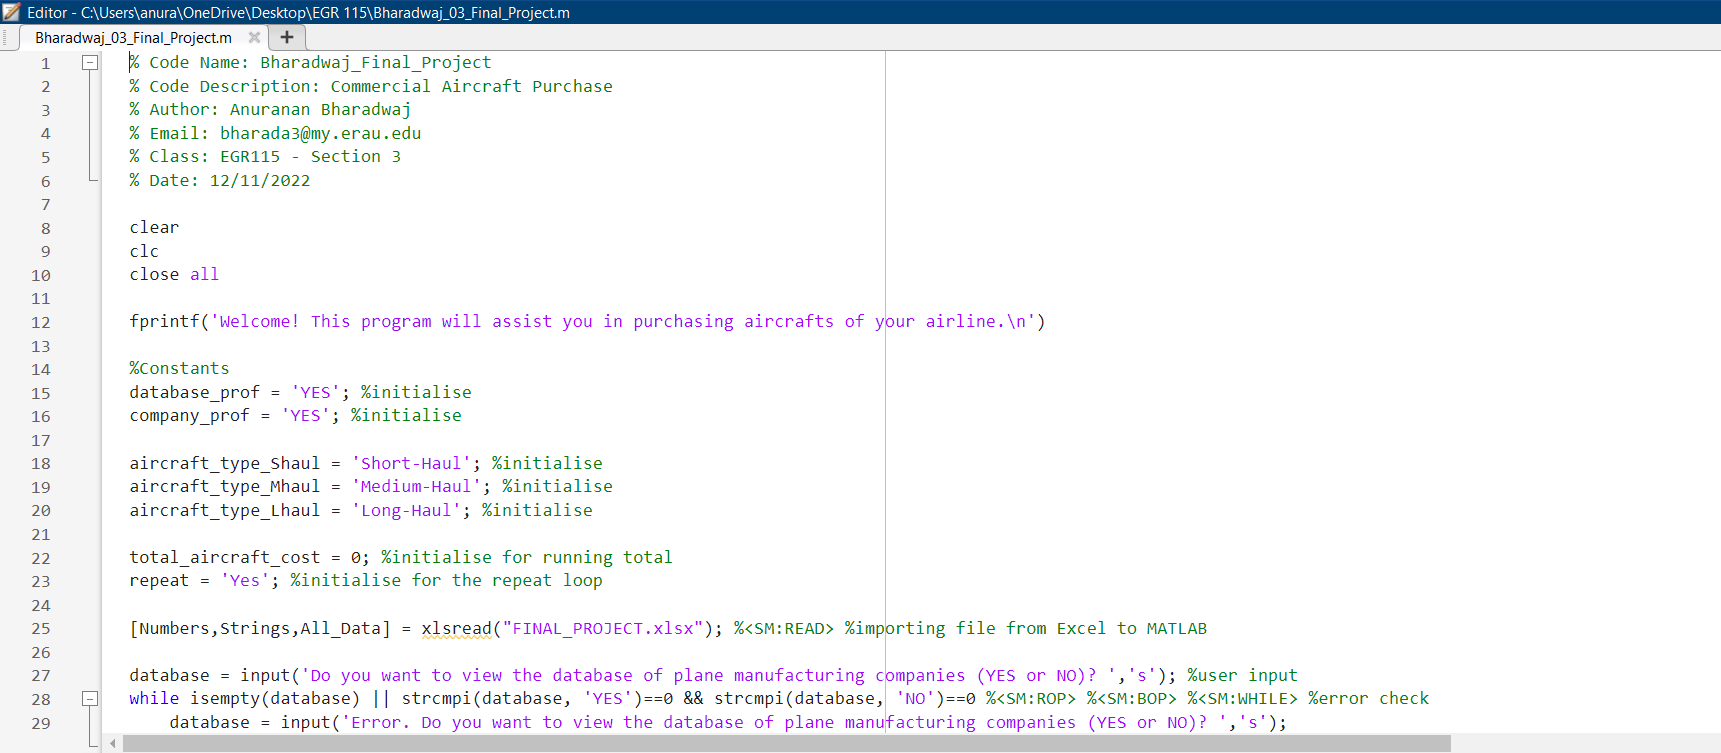
- Integrated an Excel-backed dataset for structured storage and retrieval of aircraft specifications
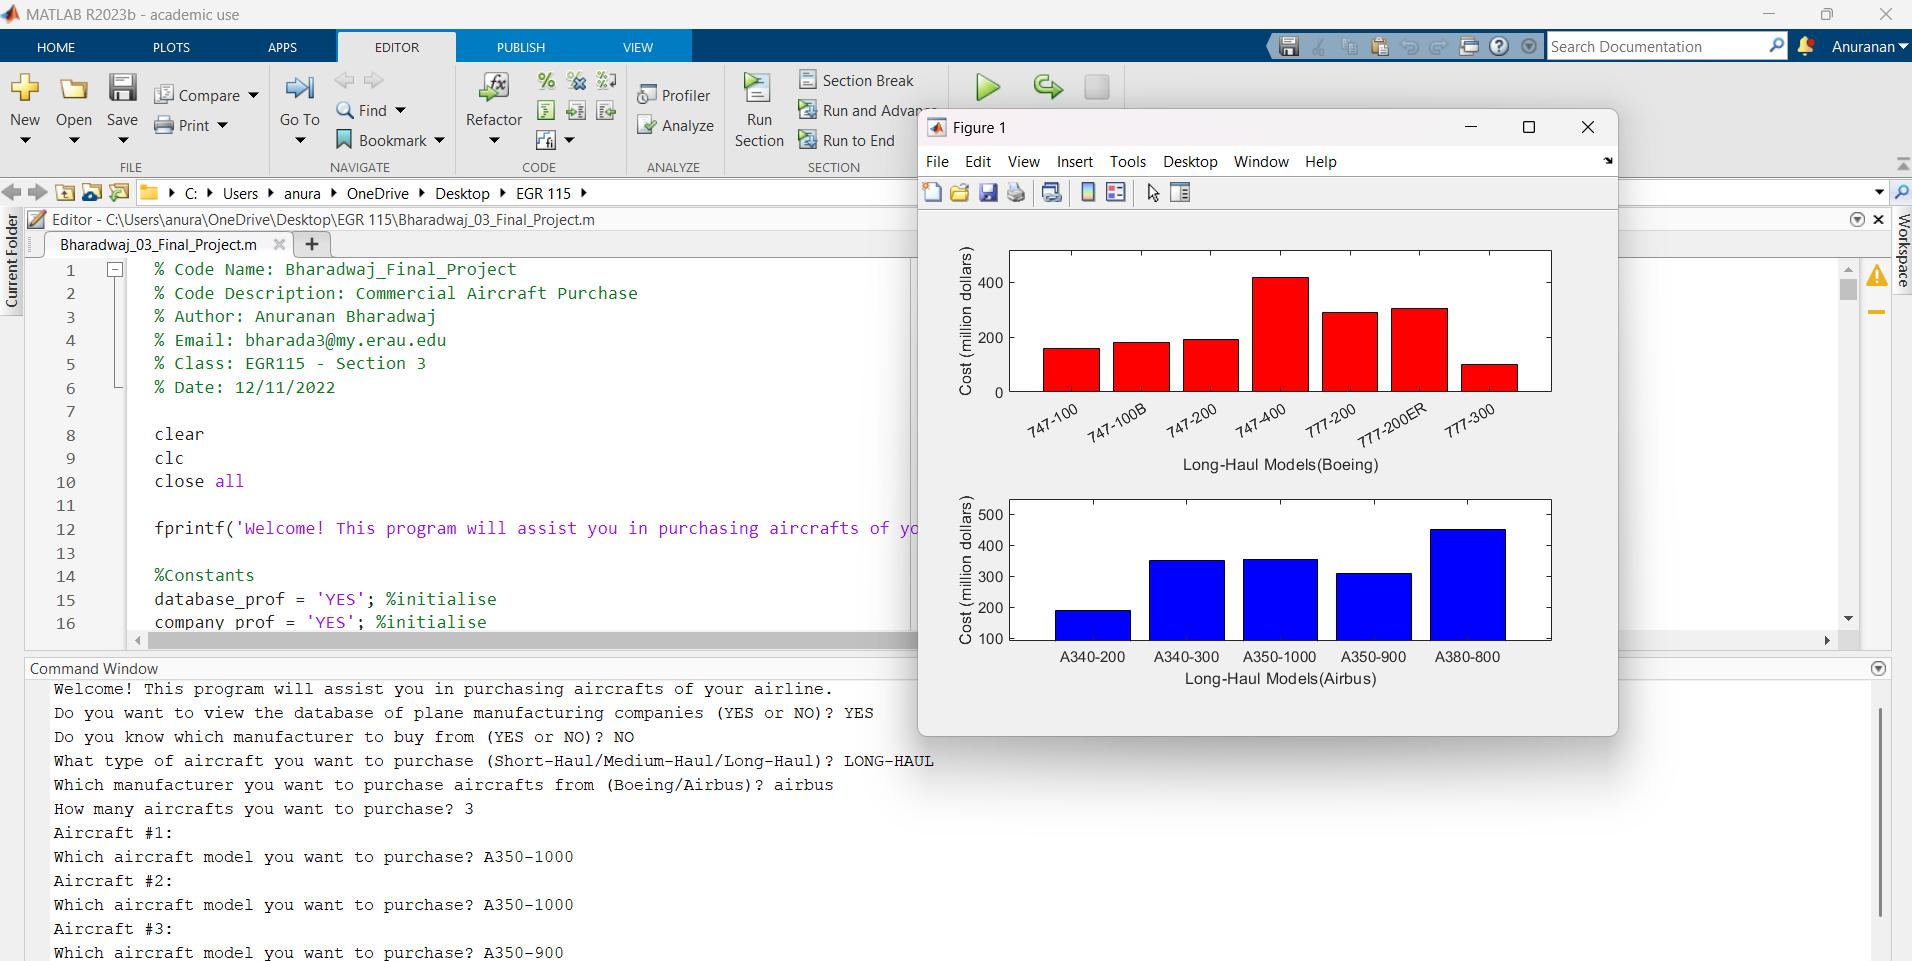
- Implemented dynamic visualizations — bar charts and scatter plots — based on the active filtered selection
- Reduced data retrieval time by approximately 25% relative to manual spreadsheet workflows
This page covers the design and development of a MATLAB-based decision support application that lets airline operators filter, compare, and visualize aircraft fleet options — replacing manual spreadsheet review with a single interactive interface backed by a live Excel dataset.
Project Overview
Fleet procurement decisions involve comparing dozens of aircraft across a wide range of performance, operational, and economic parameters. Without structured tooling, analysts are forced to manually scan spreadsheets and cross-reference multiple data sources — a slow and error-prone process. This project addressed that bottleneck by developing an interactive MATLAB application that allows airline operators to query, filter, and compare aircraft options through a single unified interface.
The application integrates a live Excel-backed dataset, making it straightforward to update aircraft records without modifying the application code. Users can apply multi-parameter filters and immediately see the filtered results in both tabular and graphical form, turning what had been a manual multi-step lookup process into a streamlined, decision-ready workflow.
- Multi-parameter filtering — a GUI-based application that allows filtering aircraft by multiple performance criteria simultaneously
- Excel-backed dataset — connects the application to an Excel dataset so records can be updated without redeploying code
- Dual output views — displays filtered results in both sortable tables and comparative visualizations
- ~25% faster retrieval — reduces the time required to retrieve and compare candidate aircraft versus manual spreadsheet methods
Application Design
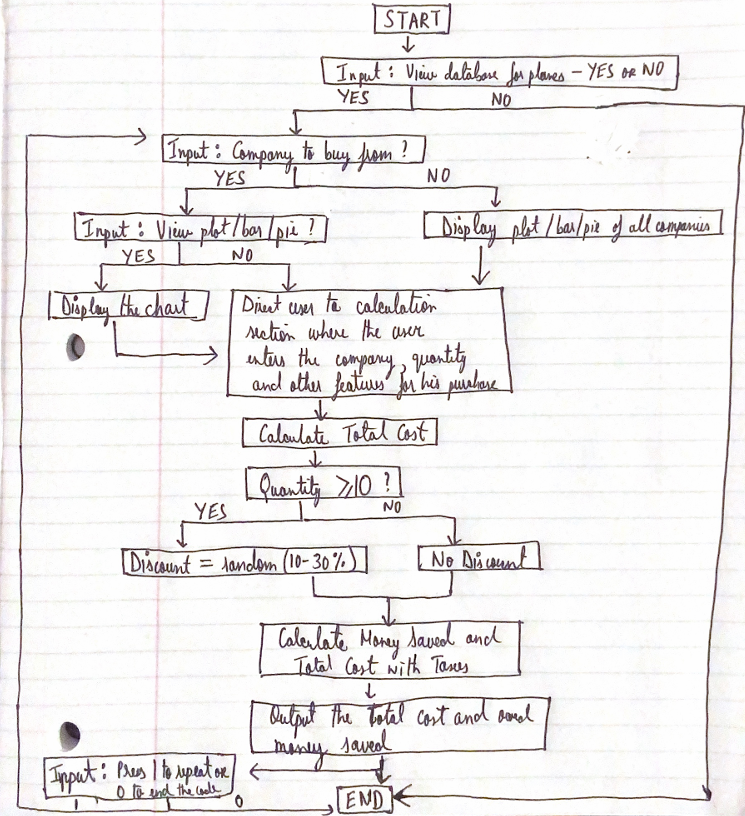
The application was built using MATLAB App Designer. The interface is divided into three functional areas: a filter panel, a results table, and a visualization panel.
- Filter panel — sets bounds on parameters such as range, maximum takeoff weight, passenger capacity, and cruise speed
- Query engine — returns only the aircraft meeting all specified criteria
- Excel integration — uses MATLAB’s
readtablefunction to load the dataset at application startup - Decoupled data layer — adding a new aircraft or updating a specification requires only editing the Excel file, with no code changes required
- In-memory state — the loaded table is held in application state and re-queried on each filter update, keeping response times fast regardless of dataset size
Design Decision
Trade-off: Used an Excel workbook as the data backend, loaded into an in-memory table at startup, rather than standing up a relational database (e.g., SQL) behind the application.
Why: The fleet dataset is small (dozens of aircraft, not millions of rows) and is maintained by analysts who already work in spreadsheets — a database would have added setup and maintenance overhead without a corresponding performance benefit at this scale. Loading the whole table once with readtable and filtering in memory gave sub-100ms response times while keeping the data editable by anyone with Excel, no SQL knowledge required.
The visualization panel generates comparative charts dynamically based on the filtered selection. A direct side-by-side bar chart is shown when the filtered set is small; a scatter plot of two user-selected parameters provides an overview when more results are present, helping identify dominant options at a glance.
Key Takeaways
Separating data from code reduces maintenance cost
Storing the aircraft dataset in Excel instead of hardcoding it into the application meant the data could be updated by anyone without touching MATLAB. This separation of data and logic is a fundamental software design principle that pays off immediately when requirements change.
Visualization type should match the comparison task
A bar chart works well for comparing two aircraft directly; a scatter plot is more informative with many results. Choosing the chart type based on the number of results — rather than using one type for everything — made the output immediately interpretable without extra effort from the user.
Multi-parameter filtering exposes non-obvious tradeoffs
When users applied simultaneous constraints on range, capacity, and fuel efficiency, the filtered set often surfaced counter-intuitive candidates — aircraft competitive on two parameters but weak on a third. The tool made these tradeoffs visible in a way that manual spreadsheet review rarely achieves.
In-memory queries keep the GUI responsive
Loading the Excel table once at startup and running filter logic on the in-memory table — rather than re-reading the file on each query — kept filter response times under 100ms regardless of dataset size. Re-reading on every filter update would have made the interface feel slow and unresponsive.