Experimental Aerodynamics Labs
AE 315 · Experimental Aerodynamics · Spring 2025 · ERAU
Lab 01: Wind Tunnel Characterization
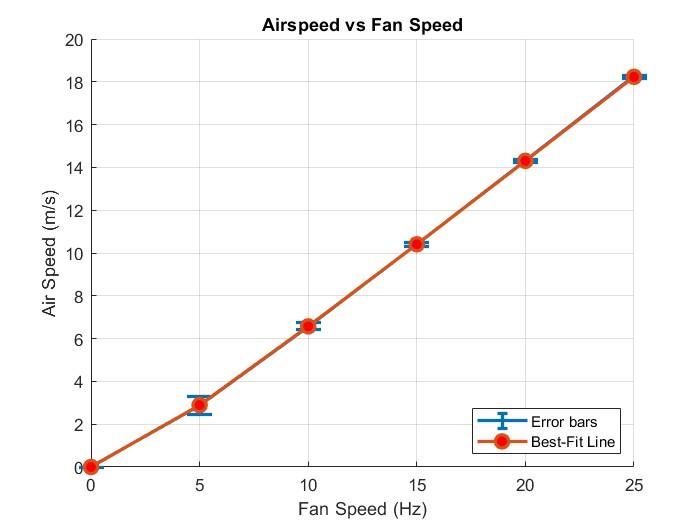
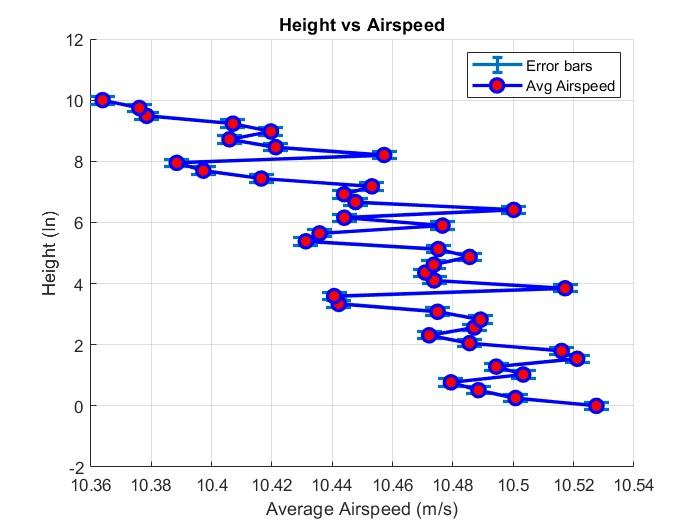
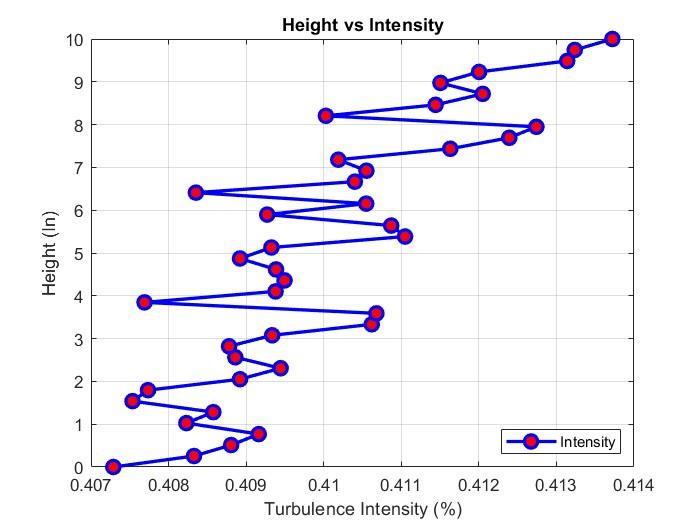
Characterized the ERAU open-circuit wind tunnel by mapping airspeed across fan frequencies (5–25 Hz) and probe heights (1–40 in) using a traverse pitot-static probe. Demonstrated a direct correlation between fan frequency and freestream velocity (up to 18.2 m/s) and quantified turbulence intensity growth with height. Uncertainty was propagated and visualized in MATLAB.
Lab 02: Flow Around Cylinders
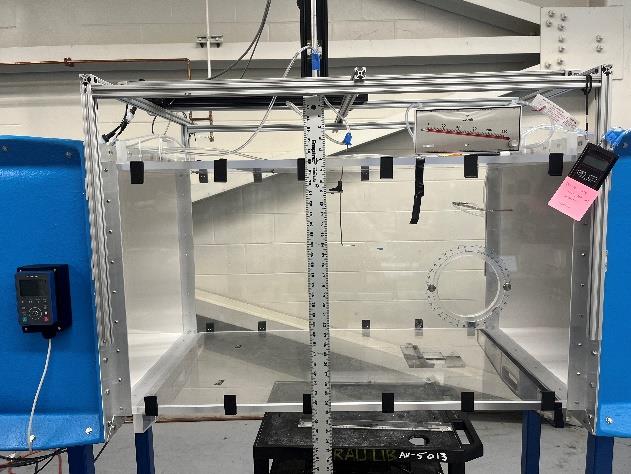
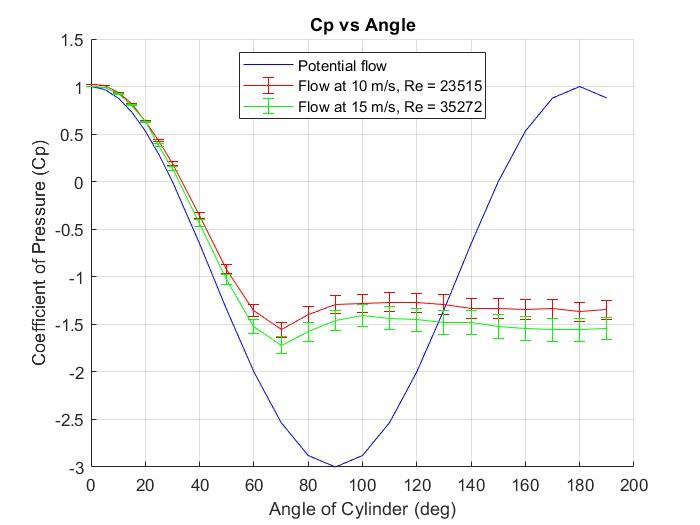
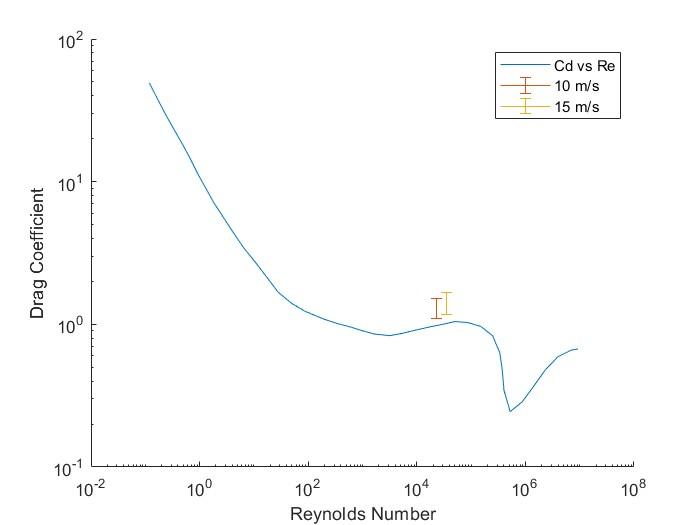
Measured circumferential surface pressure distributions on a 1.4-inch cylinder at 10 m/s (Re ≈ 23,515) and 15 m/s (Re ≈ 35,272) to extract Cp, Cd, and drag force. Compared experimental Cp profiles to potential flow theory; both regimes were subcritical, with Cd increasing from 1.31 to 1.42 as velocity rose.
Lab 03: Lift and Drag on Airfoils
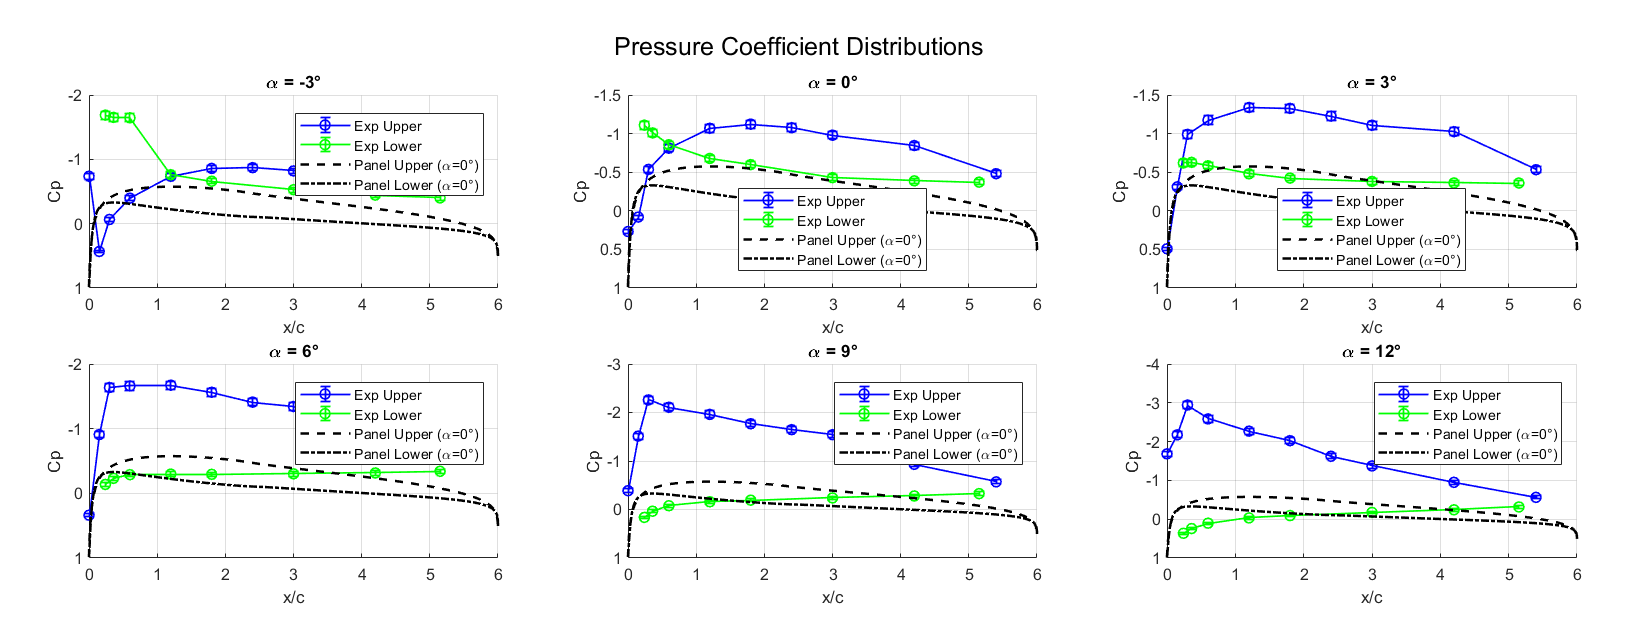
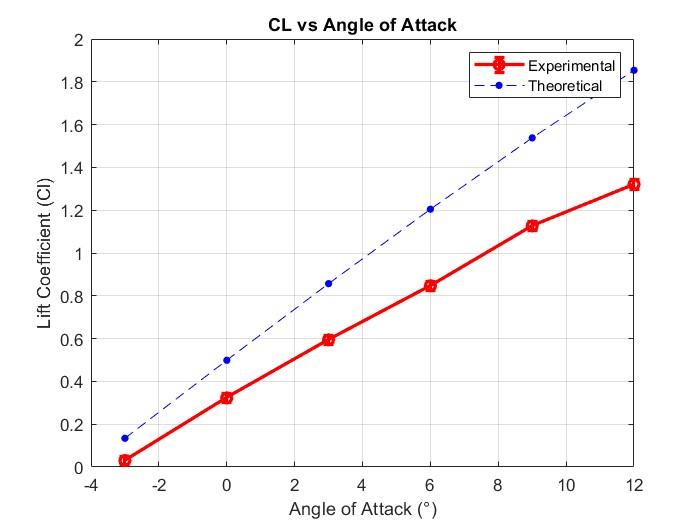
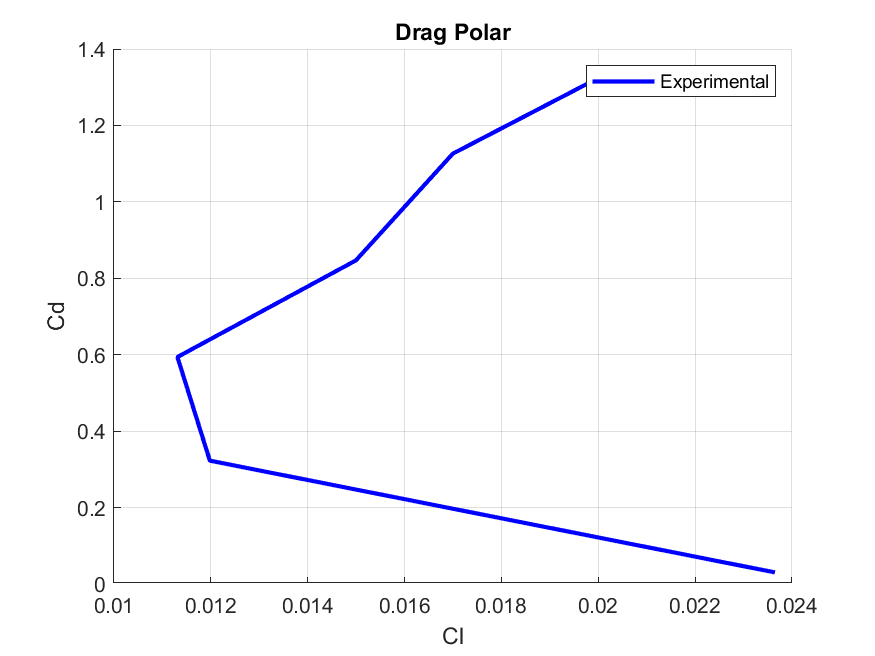
Evaluated aerodynamic performance of a NACA 4412 airfoil at 15 m/s across angles of attack from −3° to 12° using 18 surface pressure taps and a traversing pitot-static wake survey. Extracted Cl, Cd, and moment coefficients and compared to panel code predictions. Zero-lift angle of attack was determined to be −3.31°.
Lab 04: Forces and Moments on a Canard Delta Wing
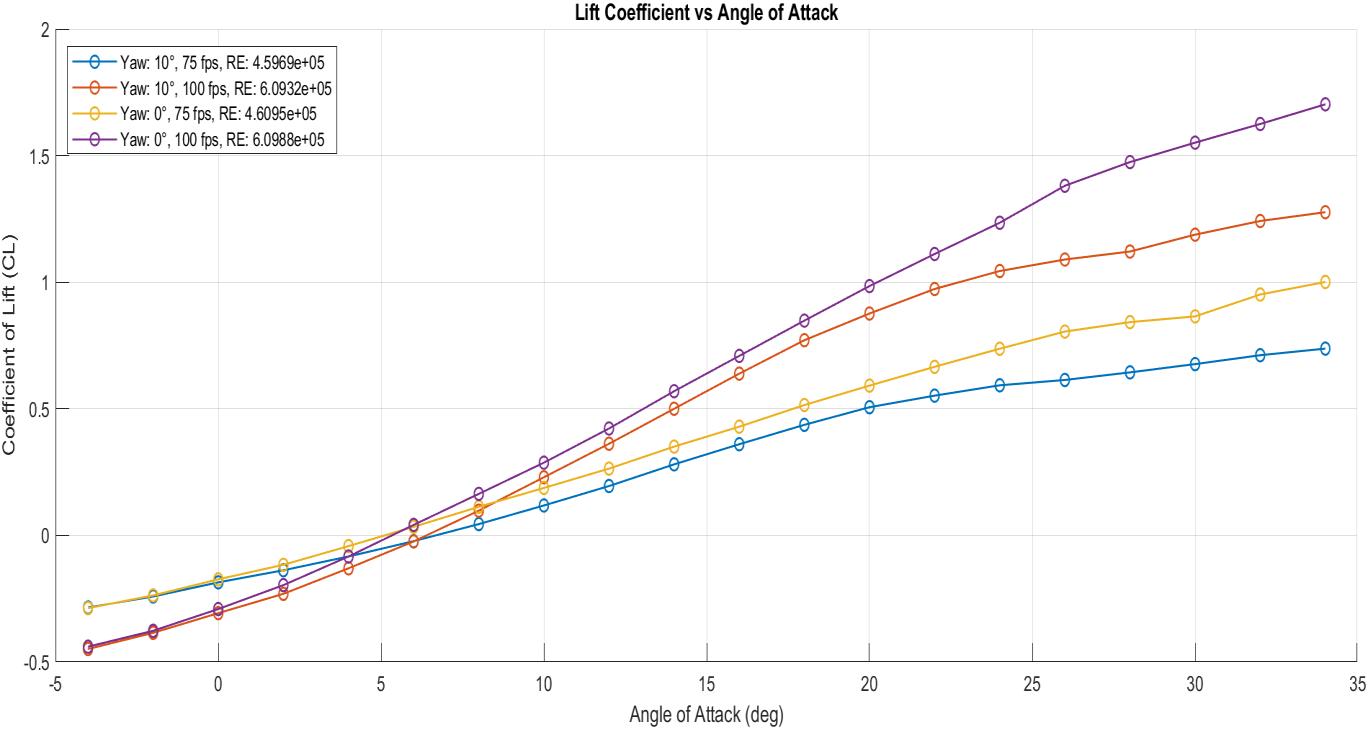
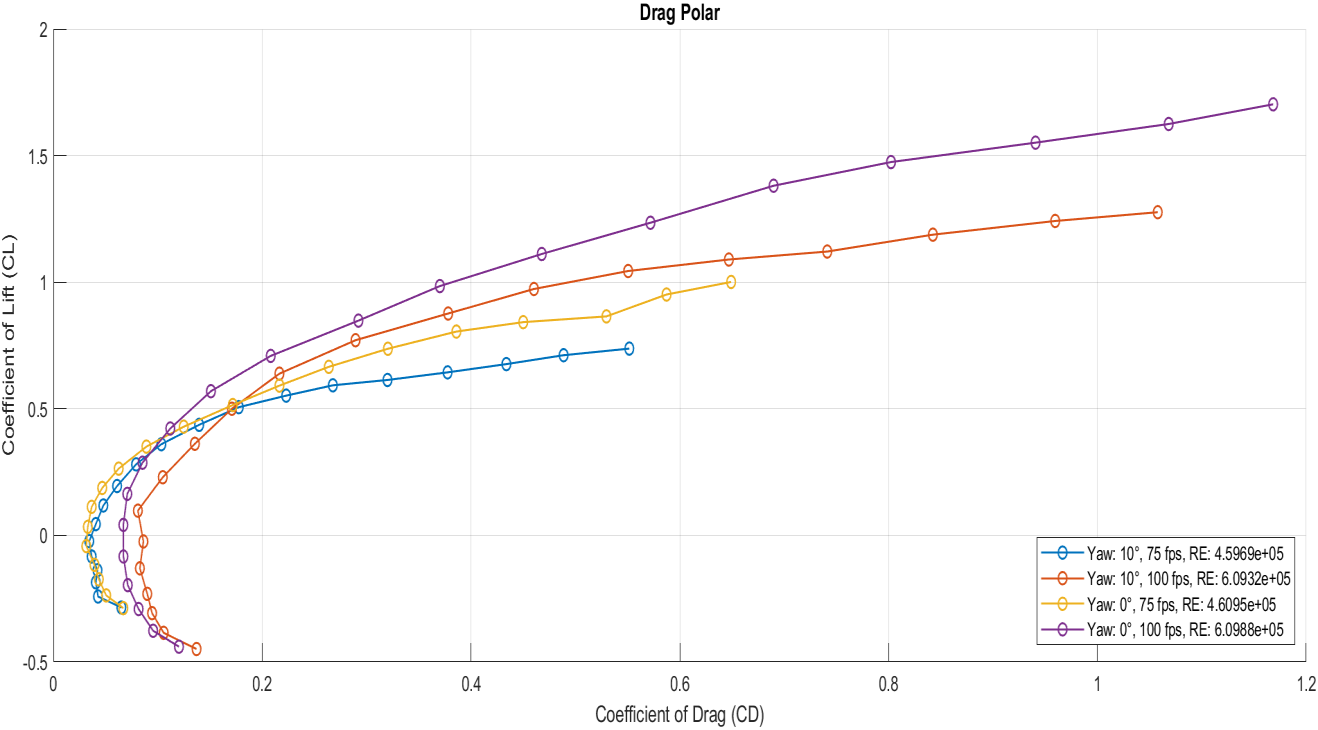
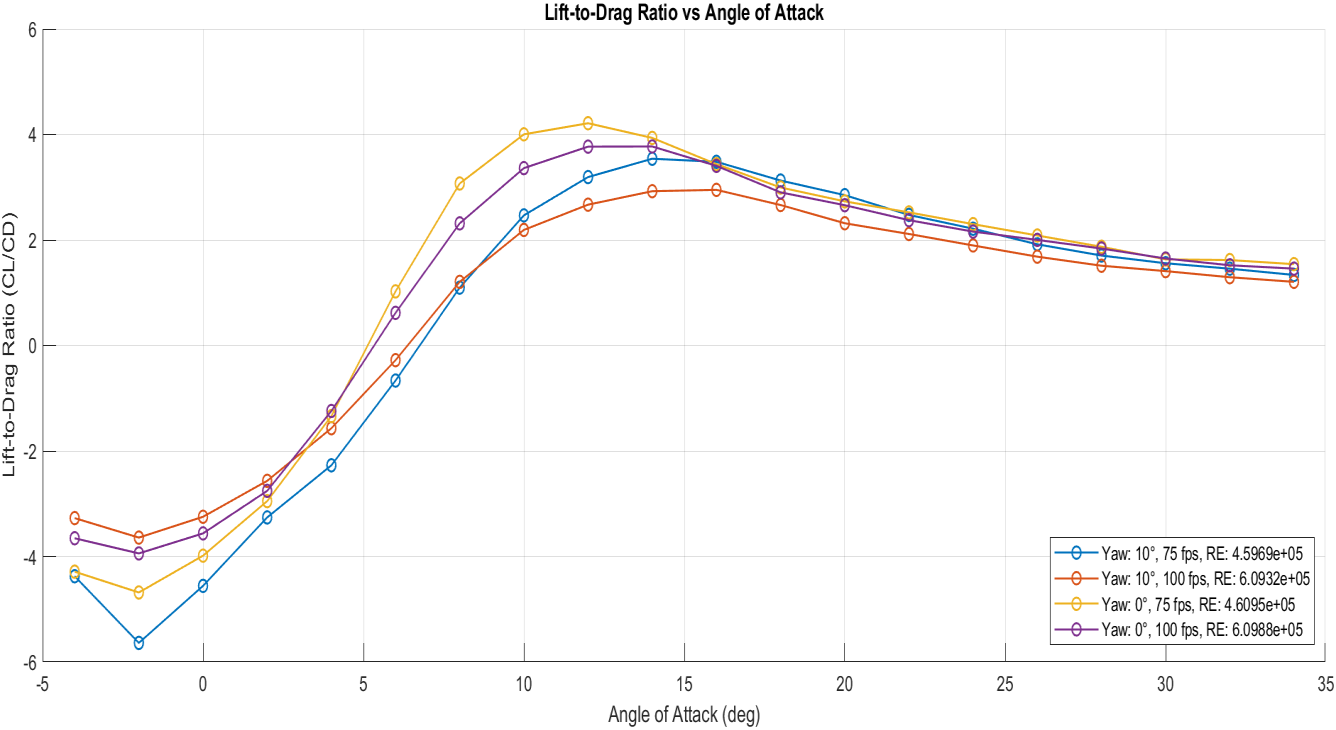
Used the ERAU Micaplex Wind Tunnel force balance to measure all six aerodynamic loads on a canard-delta wing at 75 fps and 100 fps with 0° and 10° yaw angles. Applied aerodynamic tares for data correction. CL rose linearly to ~25° AoA before flow separation; best CL/CD of 4.21 achieved at 12° AoA.
Lab 05: Schlieren Imaging & Supersonic Wind Tunnels
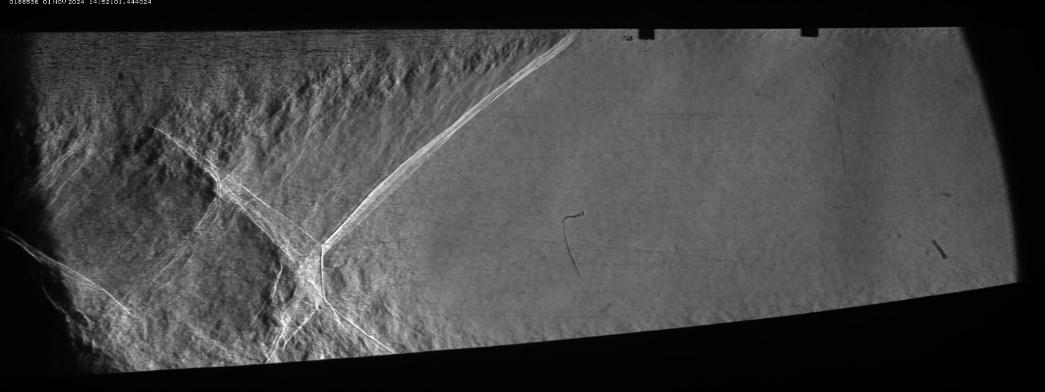
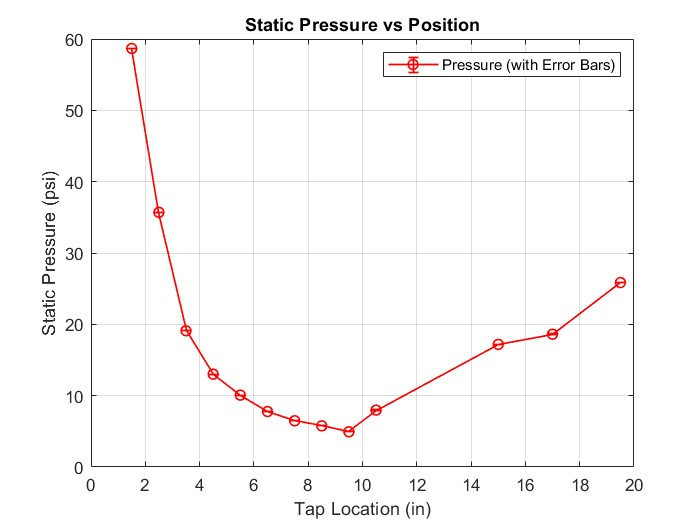
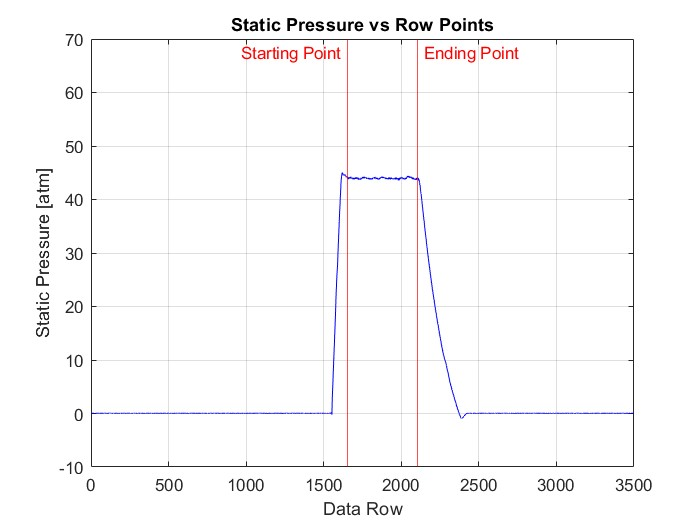
Operated the ERAU supersonic wind tunnel and used Schlieren photography to visualize a shock wave between nozzle positions 9.5–10.5 inches. Computed nozzle pressure ratio (NPR = 3.932), shock strength (1.614), and mass flow rate (6.10 lbm/s) from static pressure tap data.