Structures & Instrumentation Labs
AE 417 · Aerospace Structures and Instrumentation Laboratory · Fall 2025 · ERAU
Lab 01: Honeycomb Compression Test
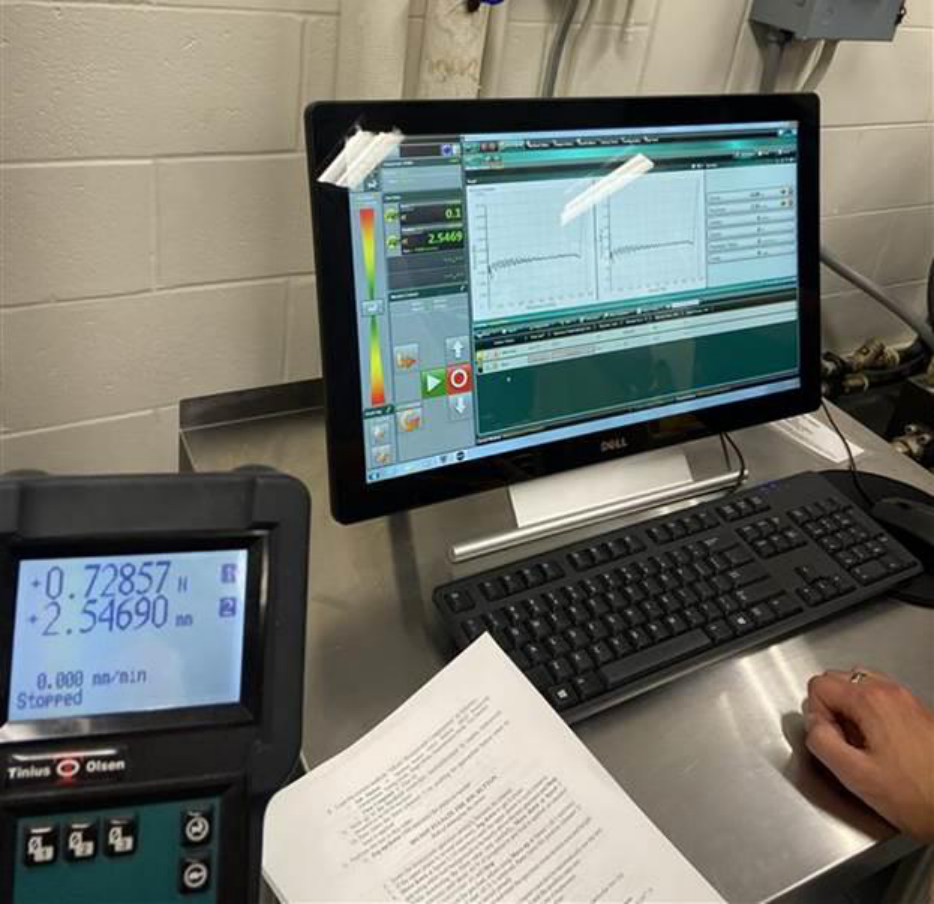
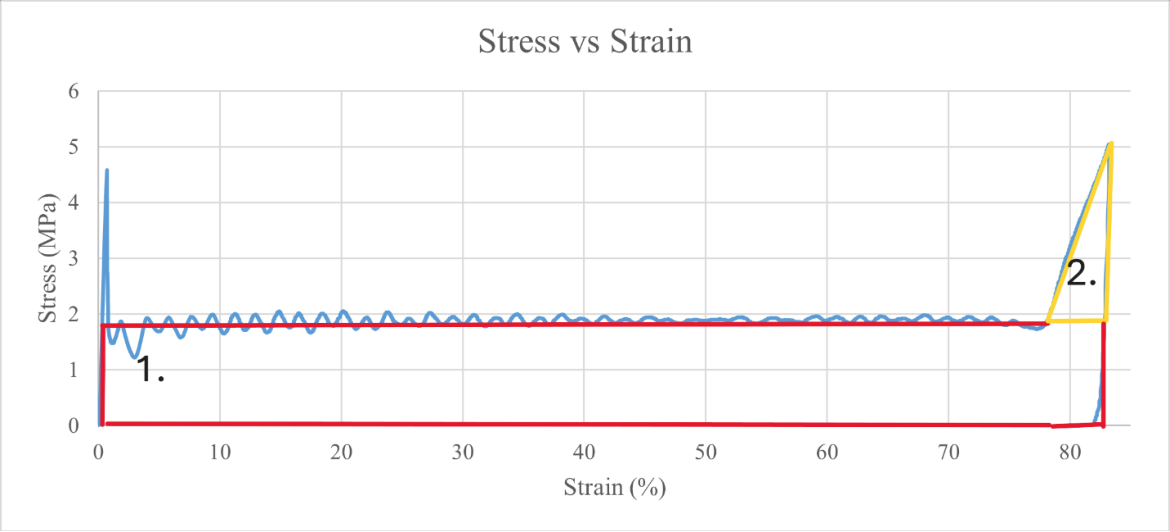
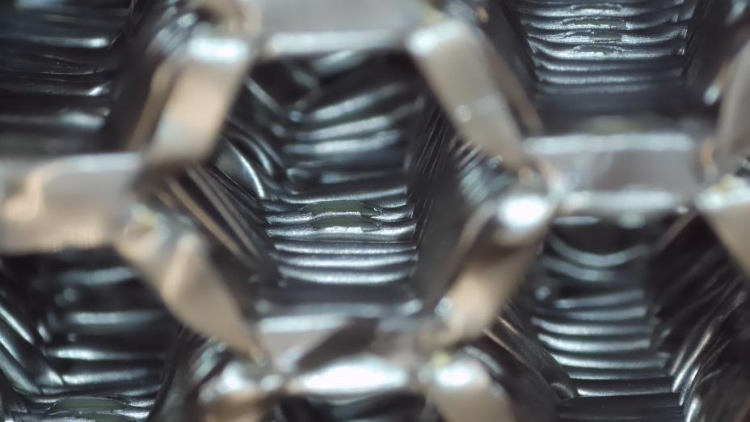
Characterized out-of-plane compressive behavior of an aluminum honeycomb core per ASTM D 7336/D 7336M-07 using the Tinius Olsen 150ST universal testing machine. Observed a three-stage response — linear elastic loading, progressive cell-wall buckling at near-constant crush force, and final densification. Peak stress of 4.5 MPa and crush stress of 1.87 MPa were measured; microscopy confirmed localized cell-wall folding consistent with the energy absorption mechanism.
Lab 02: Strain Gages
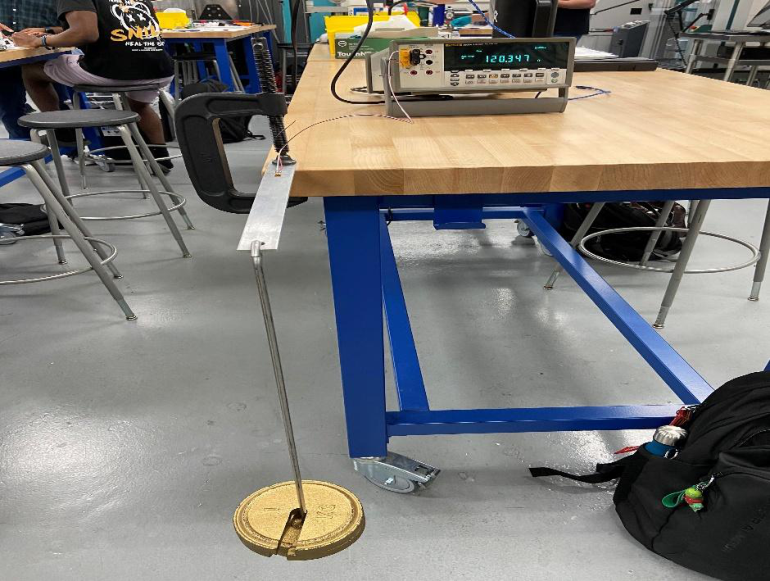
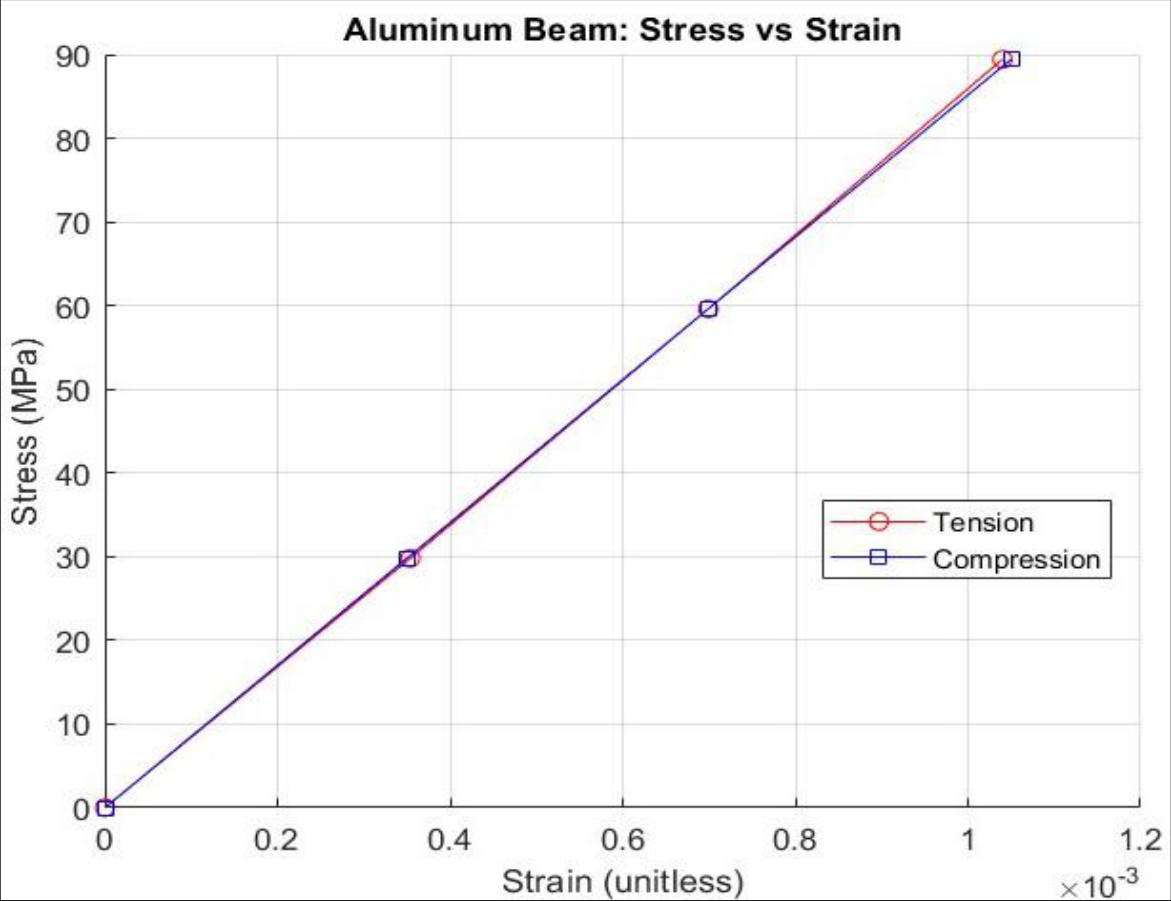
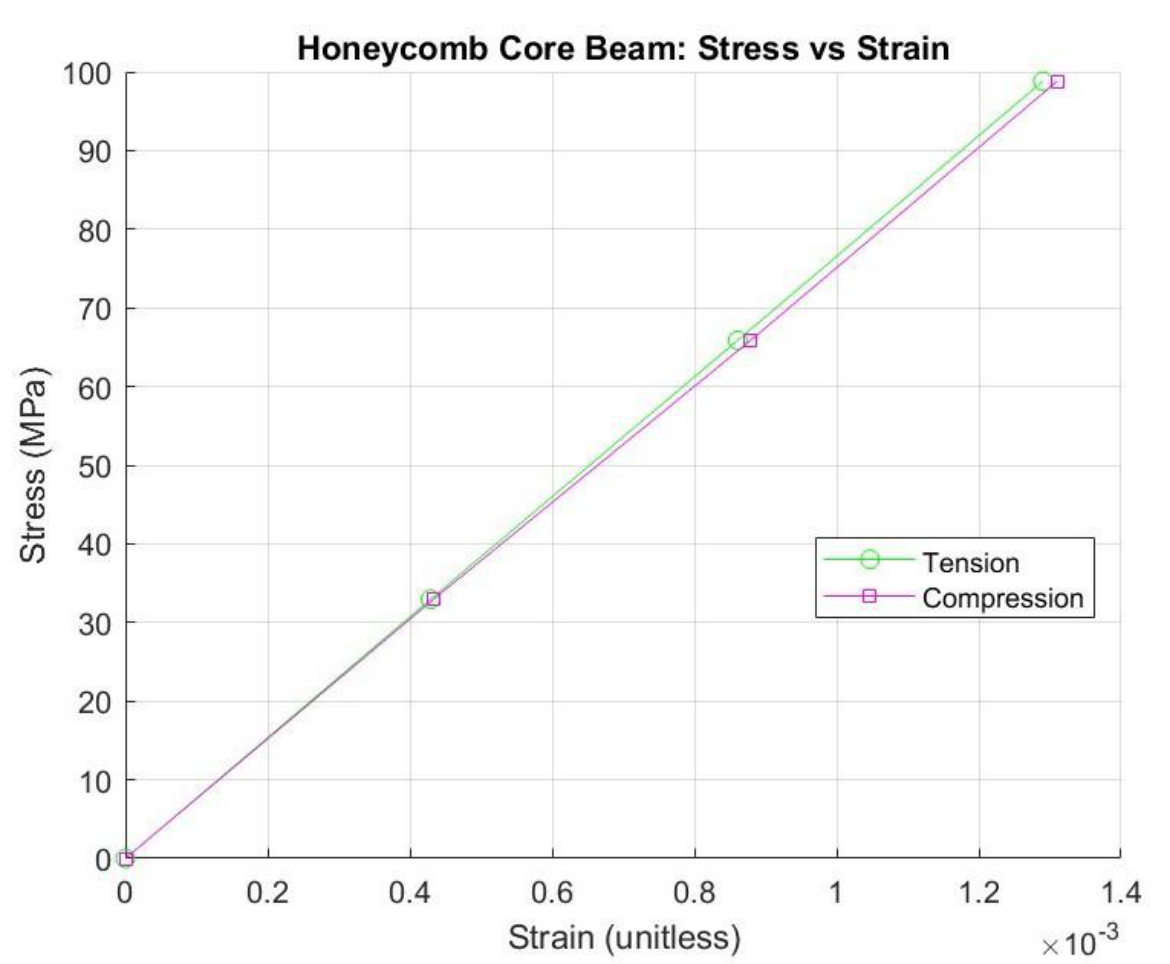
Installed 120 Ω foil strain gages on an Al 6061-T6511 beam and a Nomex honeycomb/CFRP sandwich beam, then measured resistance changes under three bending load increments in tension and compression. Extracted Young's modulus via Hooke's law: 84 GPa for aluminum (17.9% error vs. 69 GPa handbook) and 74 GPa for the CFRP sandwich beam, within the expected 70–120 GPa range for woven carbon fiber.
Lab 03: Aluminum and Composite Tensile Testing
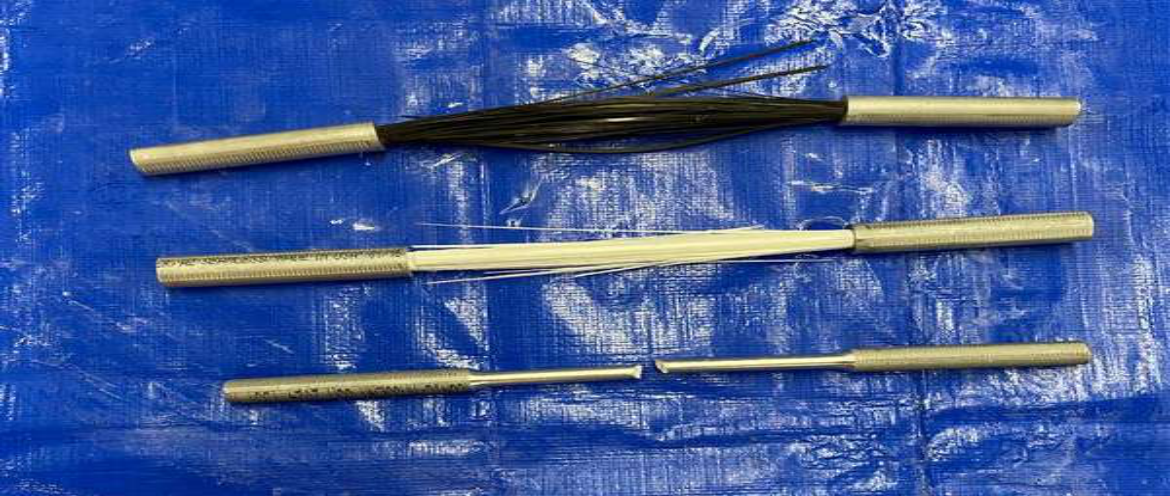
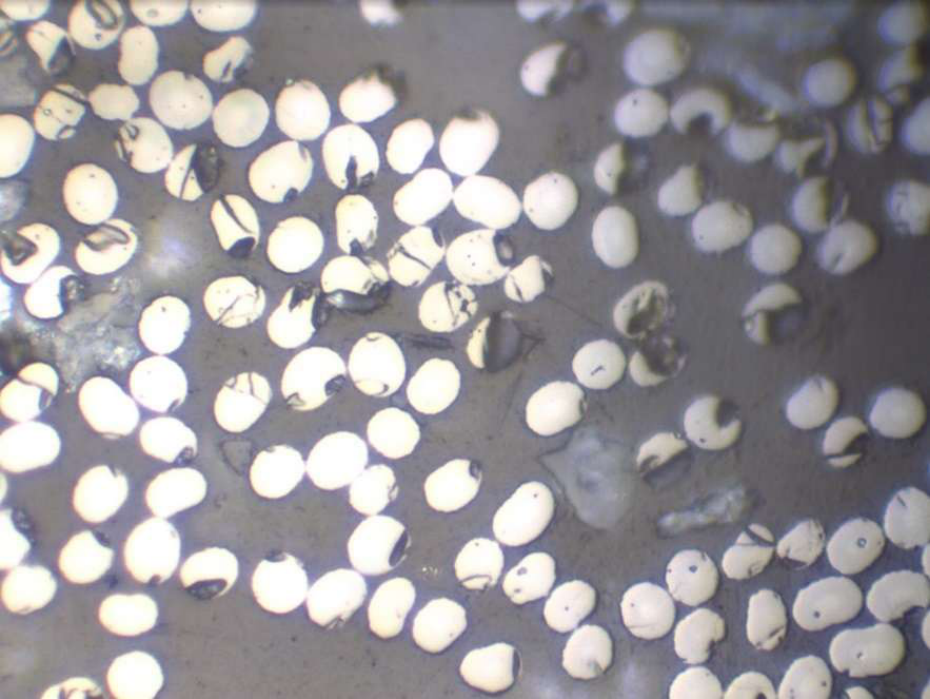
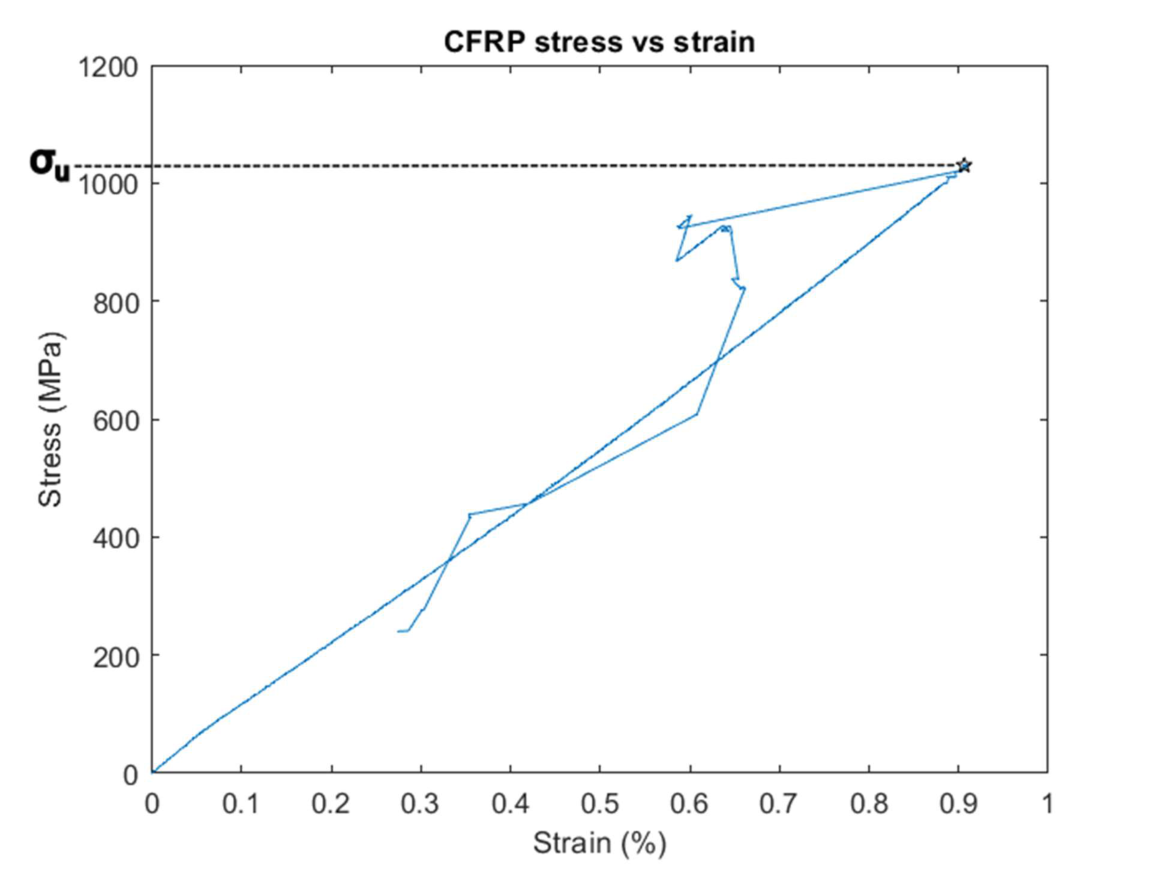
Performed uniaxial tensile testing of Al-2024-T351, GFRP, and CFRP rod specimens to fracture using a Tinius Olsen LVDT extensometer. Extracted Young's modulus, ultimate stress, and yield stress for each material; validated CFRP modulus using the rule of mixtures applied to optical metallography of polished cross-sections. CFRP achieved the highest specific strength at 717,297 MPa·mm³/g.
Lab 04: Methods for Nondestructive Evaluation
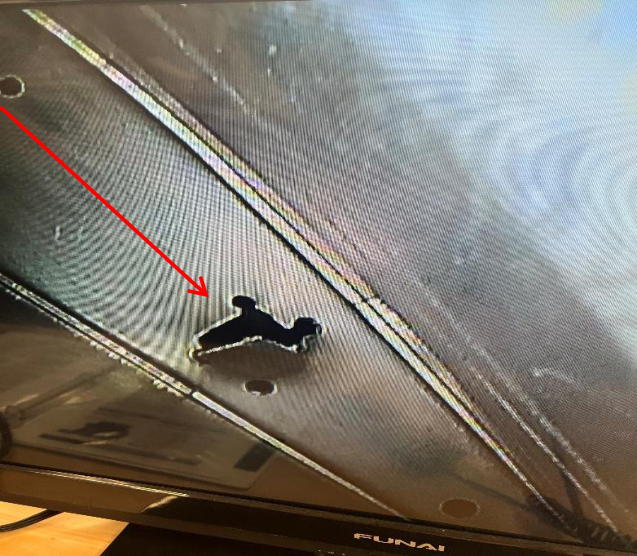
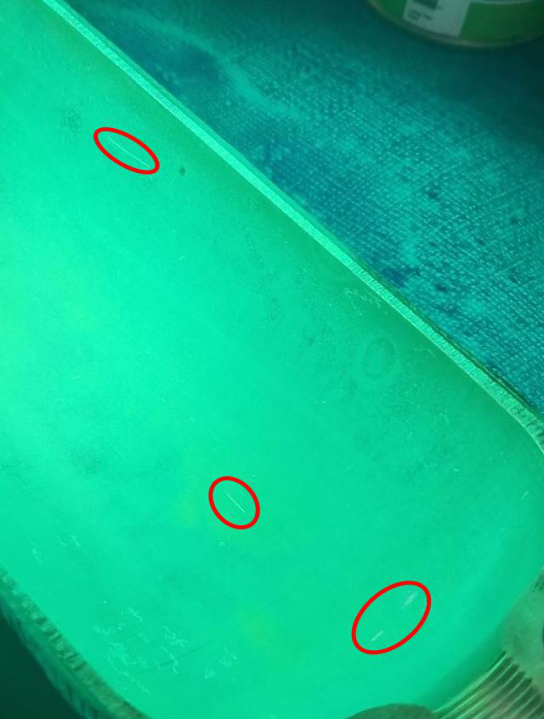
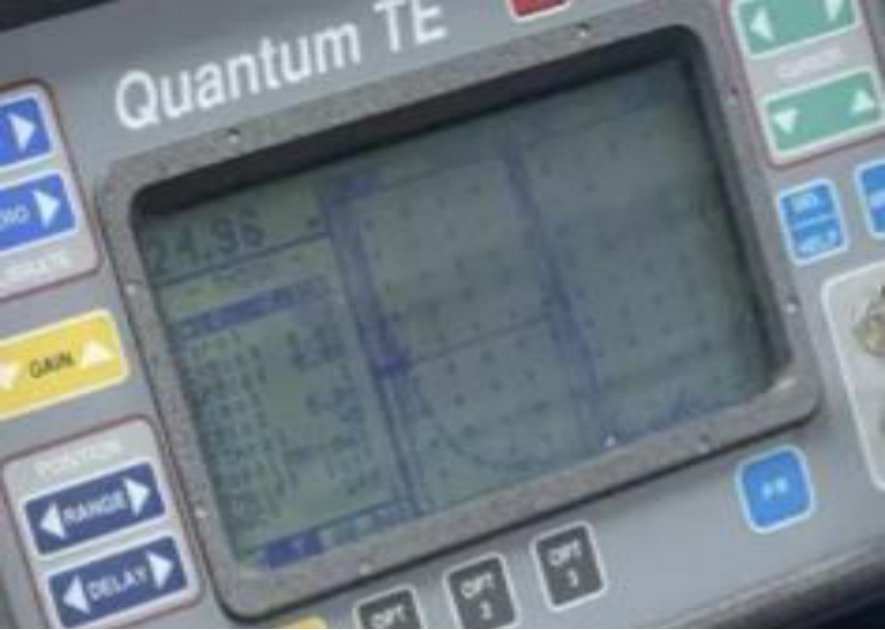
Surveyed five NDE techniques — visual inspection (borescope), liquid penetrant, thermography (FLIR T440), radiography (X-ray), and ultrasonics — applied to aircraft components and calibration blocks. Borescope imaging revealed fatigue cracks near rivet holes in an aircraft airfoil; liquid penetrant exposed eight or more sub-visible surface defects under UV light; ultrasonic pulse-echo patterns tracked known thickness steps in aluminum calibration blocks.
Lab 05: Vibration Testing of Beams
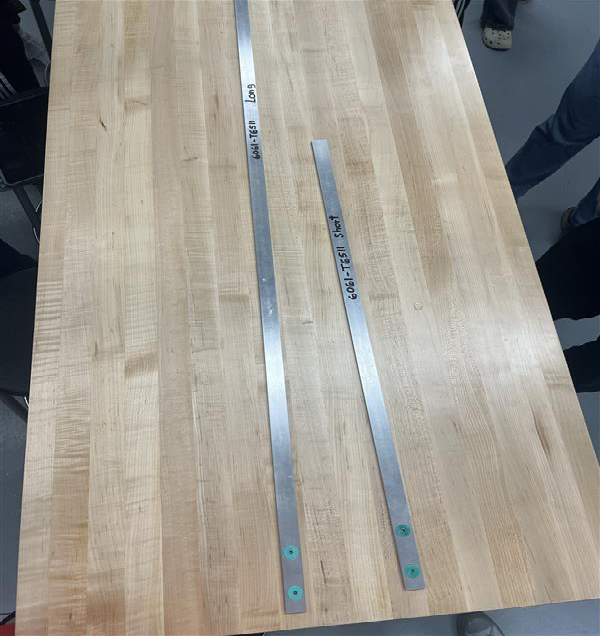
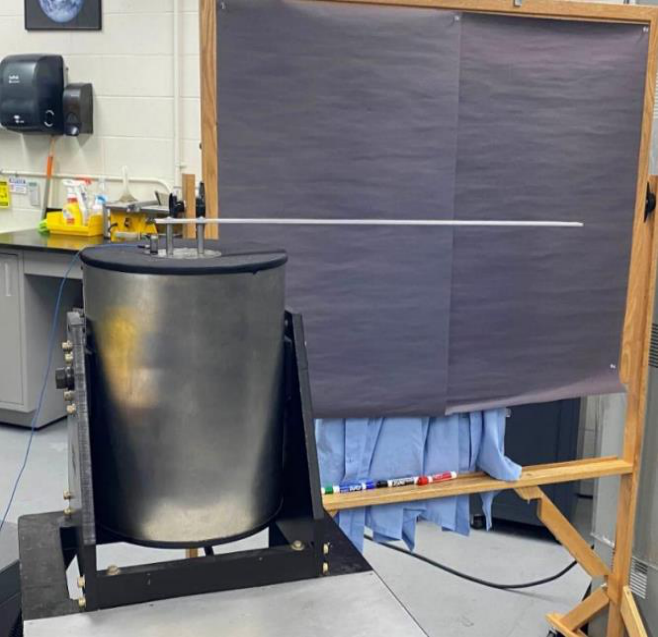
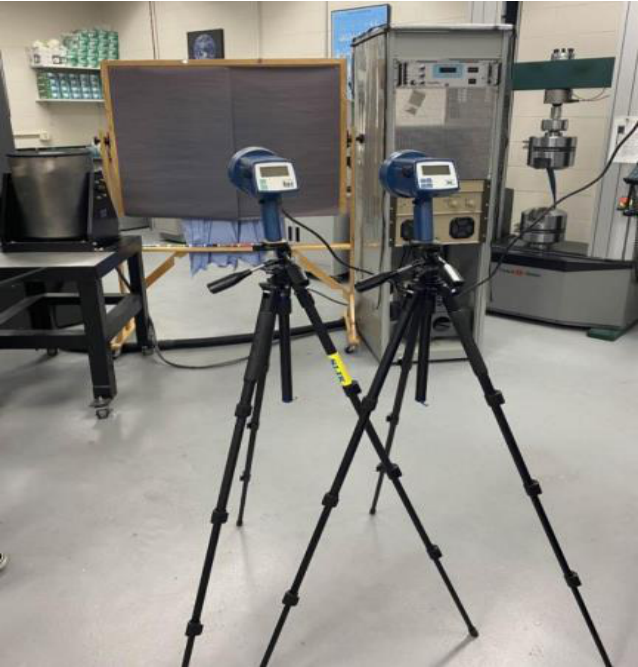
Measured bending resonance frequencies and nodal positions of short (761 mm) and long (1275 mm) Al-6061-T651 beams using an electrodynamic shaker, a digital stroboscope, an ICP accelerometer, and a digital oscilloscope. Extracted three modes for the short beam and four modes for the long beam; experimental frequencies agreed with Euler-Bernoulli beam theory within 11% and nodal positions within 3.3%.
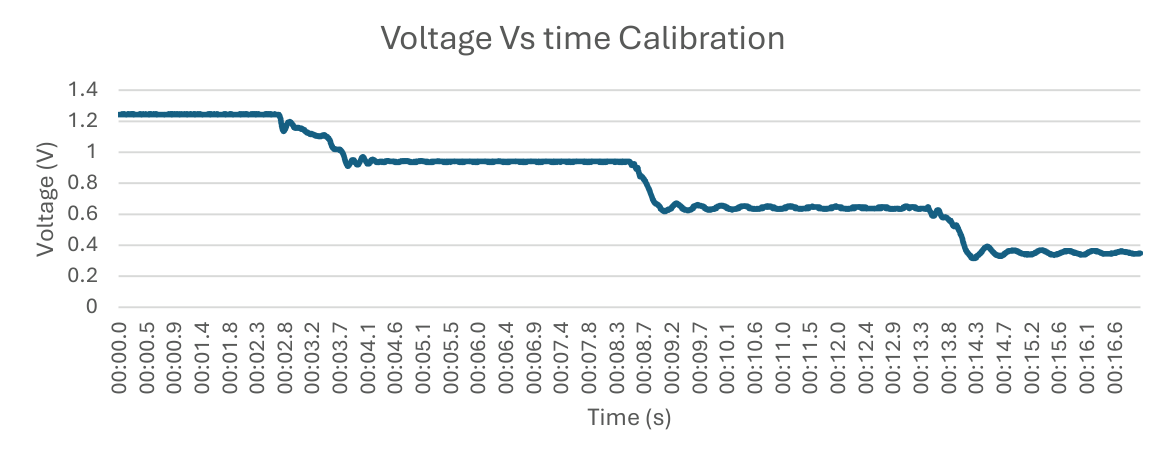
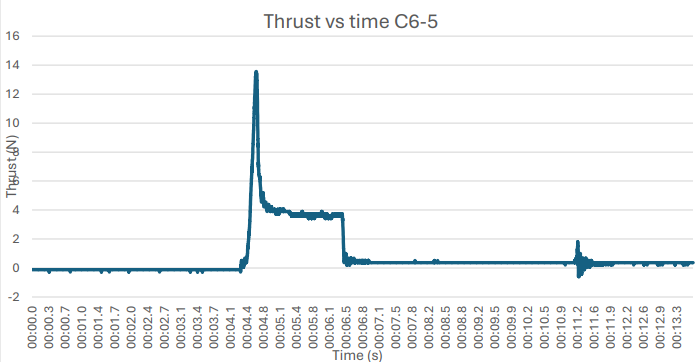
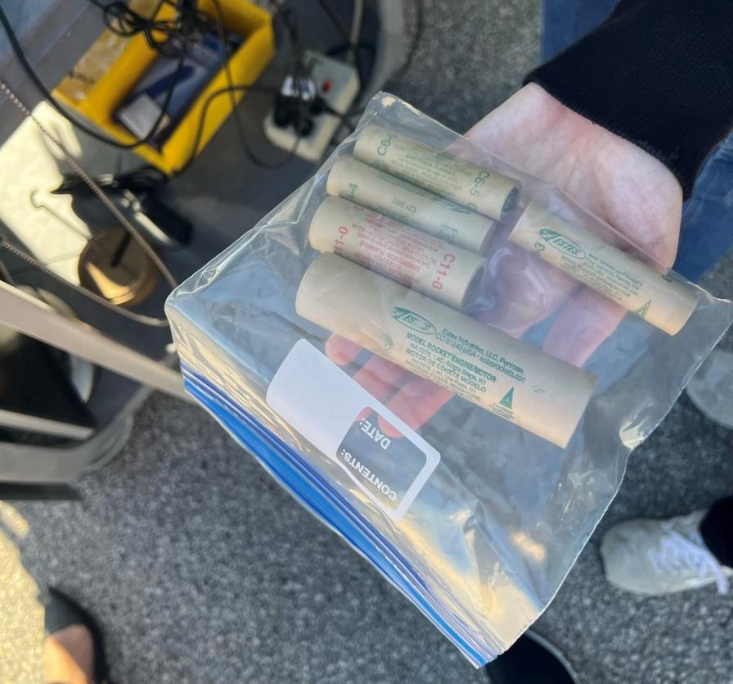
Lab 06: Rocket Thrust Measurement
Used a strain-gage cantilever beam load cell, statically calibrated with 1–3 kg masses, to record thrust-time profiles for five Estes solid rocket motors (A8-3, B4-4, C6-5, C11-0, E16-4). Extracted peak thrust, average thrust, burn time, and total impulse from each curve; C6-5 results compared to manufacturer specifications showed percent differences from 4% (delay time) to 27% (burn time).