Lab 06: Rocket Thrust Measurement
AE 417 · Aerospace Structures and Instrumentation Laboratory · Fall 2025 · ERAU
Experiment Overview
Every rocket motor — from a model rocket to a solid rocket booster — must be characterized by its thrust-time profile before it can be reliably used in a vehicle design. The thrust curve tells you peak load, average thrust, total impulse, and burn duration: the four numbers that define a propulsion system’s capability. This lab designed and calibrated a strain-gage cantilever beam load cell, then used it to fire-test five Estes solid rocket motors of increasing power class and verify their performance against published specifications.
- Build and statically calibrate a strain-gage cantilever beam load cell using known masses to create a voltage-to-force conversion
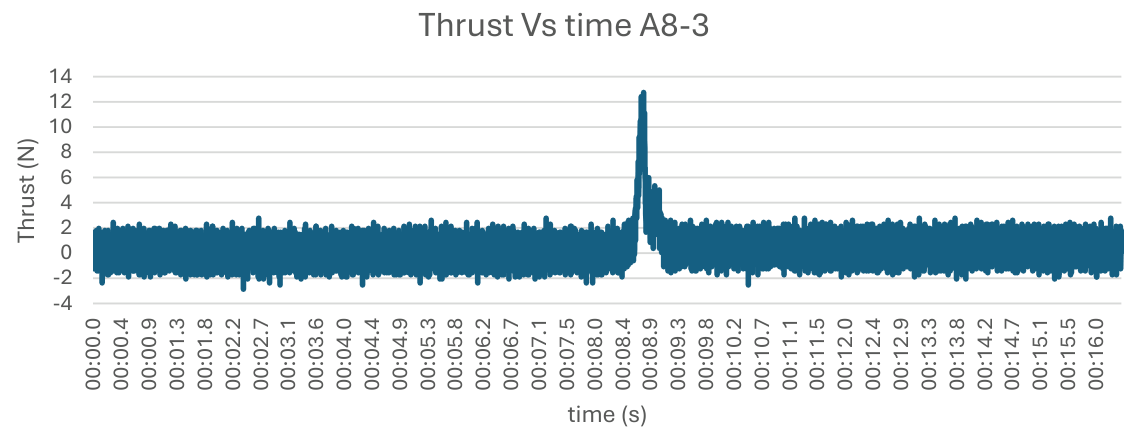
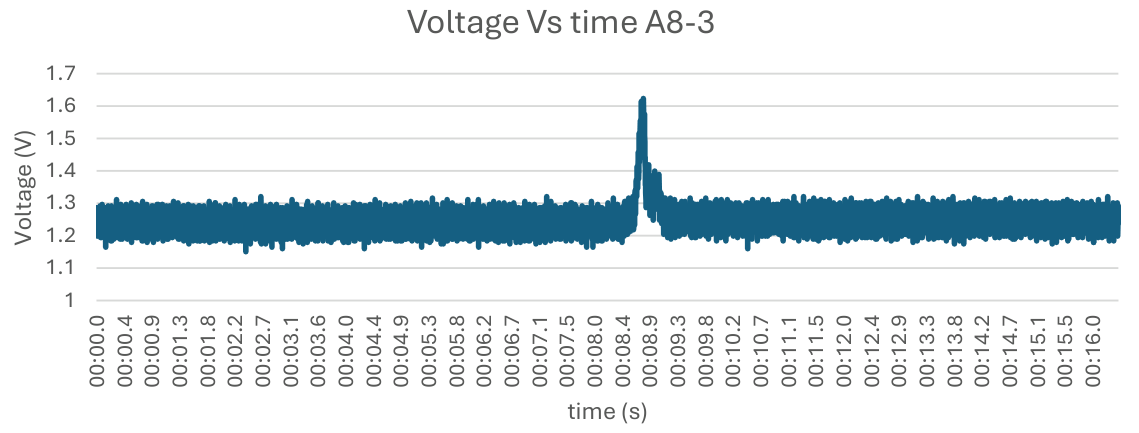
- Record thrust-time profiles for five motors: A8-3, B4-4, C6-5, C11-0, and E16-4
- Extract peak thrust, average thrust, burn time, and total impulse from each curve
- Compare C6-5 measured performance against Estes manufacturer specifications and quantify deviations
Equipment & Tools
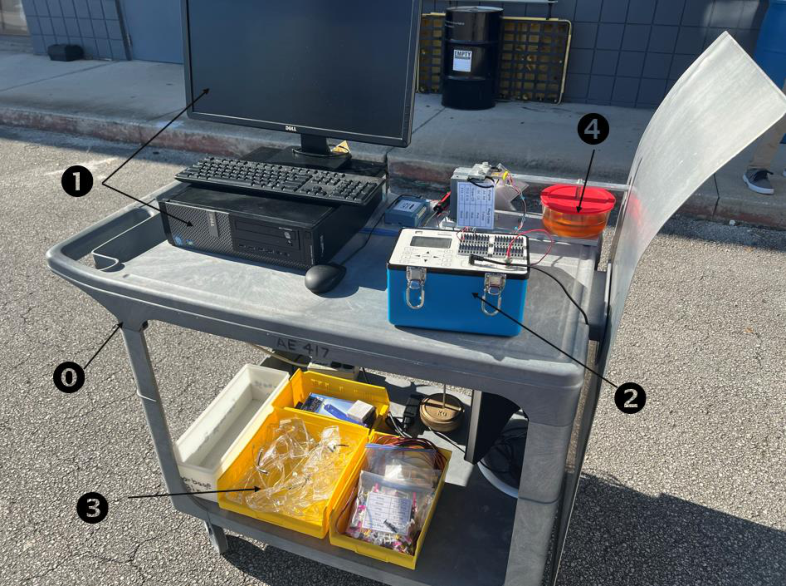
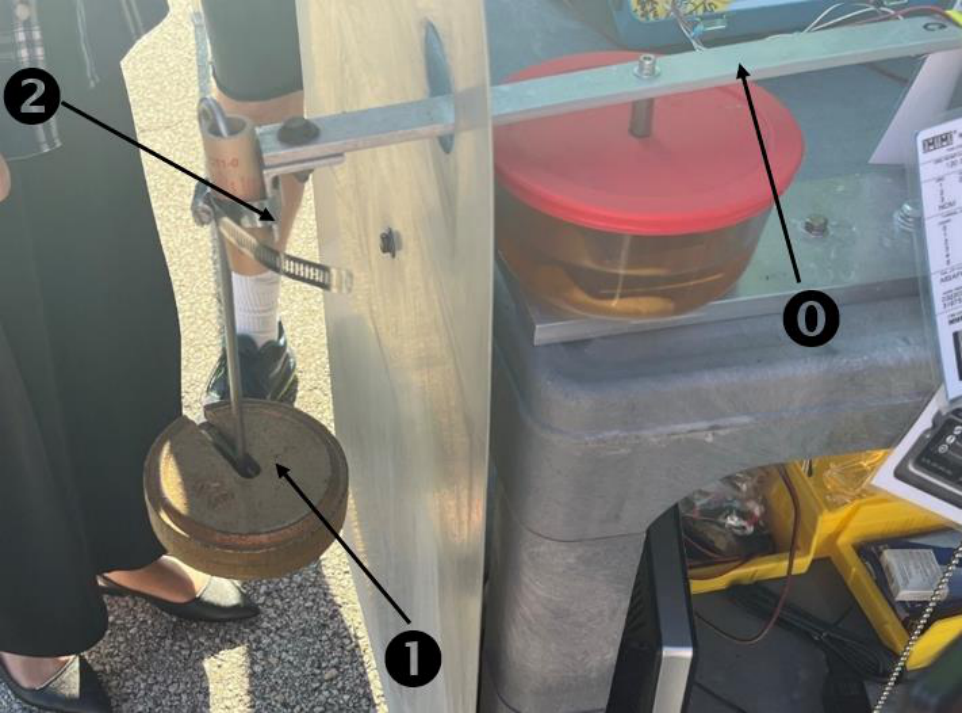
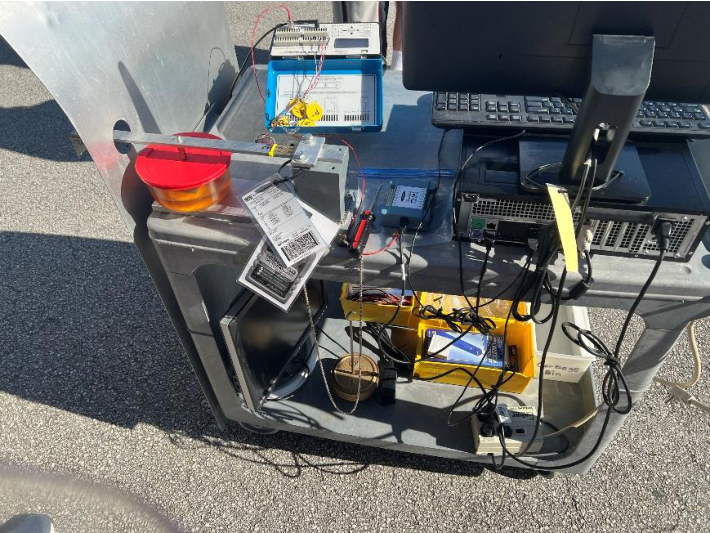
- Aluminum cantilever beam with half-bridge strain-gage load cell and digital strain indicator
- TracerDAQ data acquisition software and personal computer
- Calibration masses (1, 2, and 3 kg)
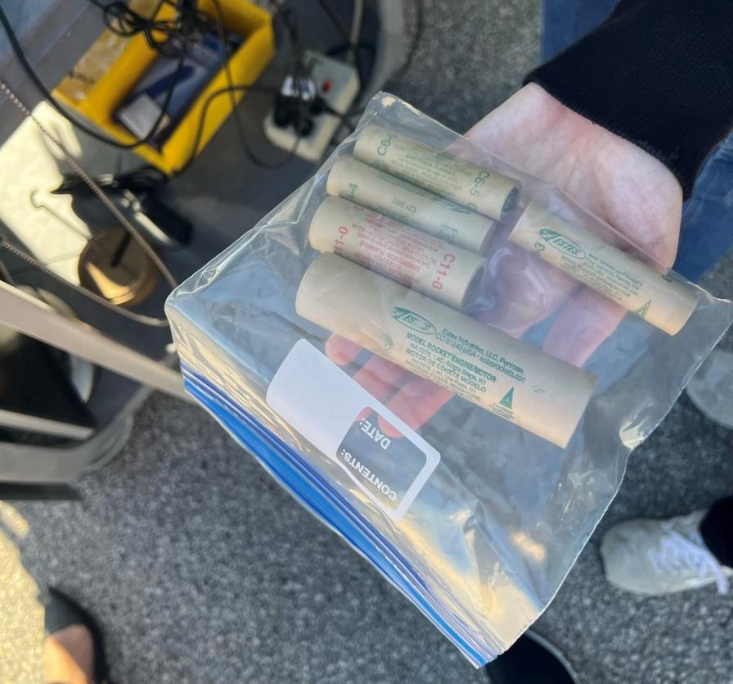
- Estes solid rocket motors: A8-3, B4-4, C6-5, C11-0, and E16-4
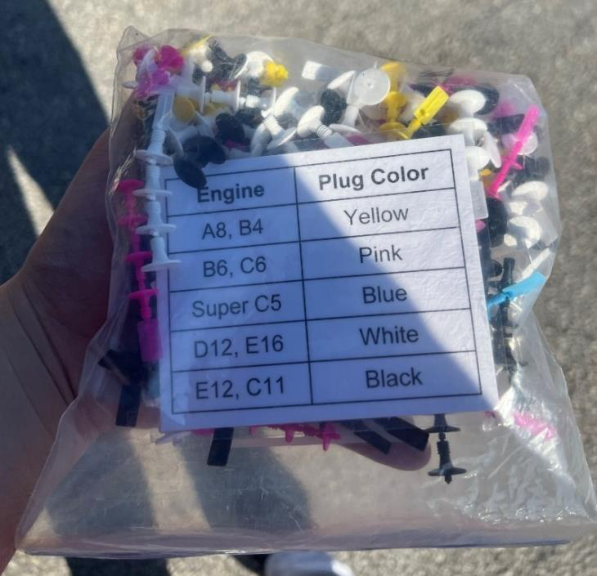
- Color-coded nozzle plugs, igniters, and launch controller (batteries, wires, alligator clips)
- Hose clamps (motor mount), STP oil treatment dashpot for vibration damping
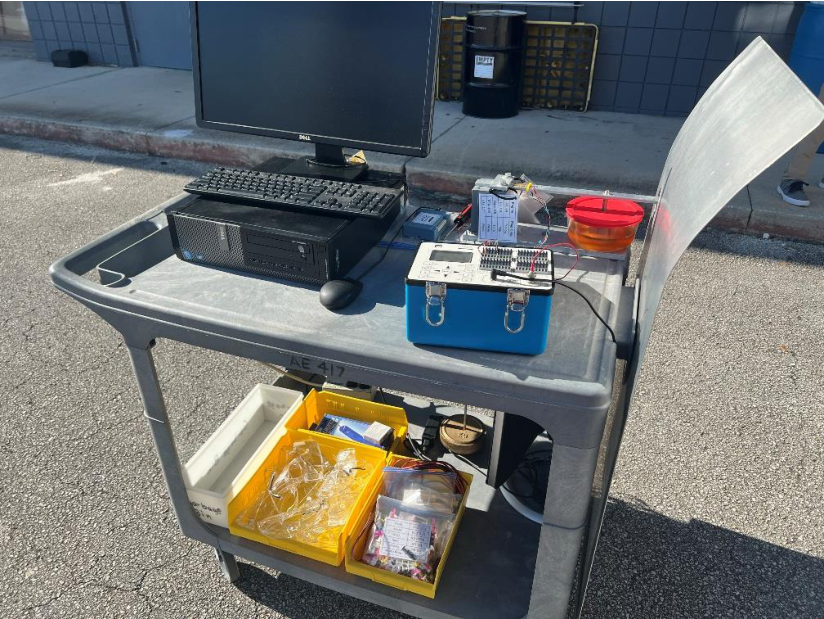
- Rolling equipment cart, outdoor canopy tent, and safety goggles
Approach & Calibration
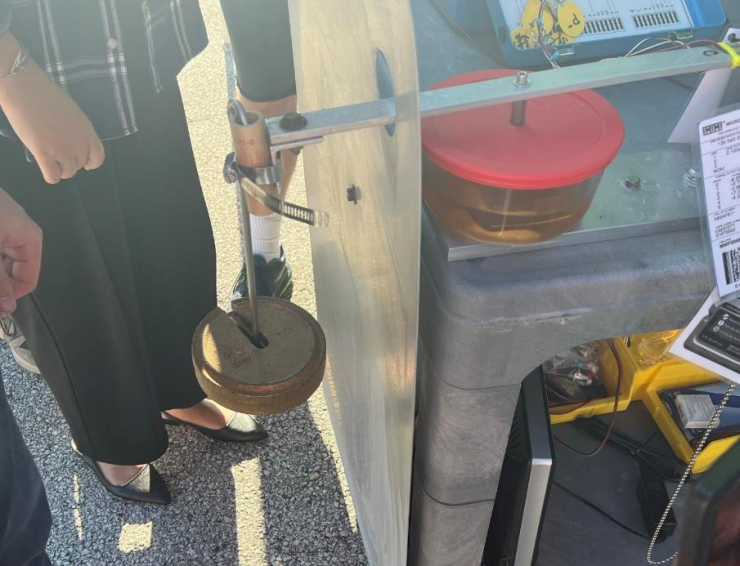
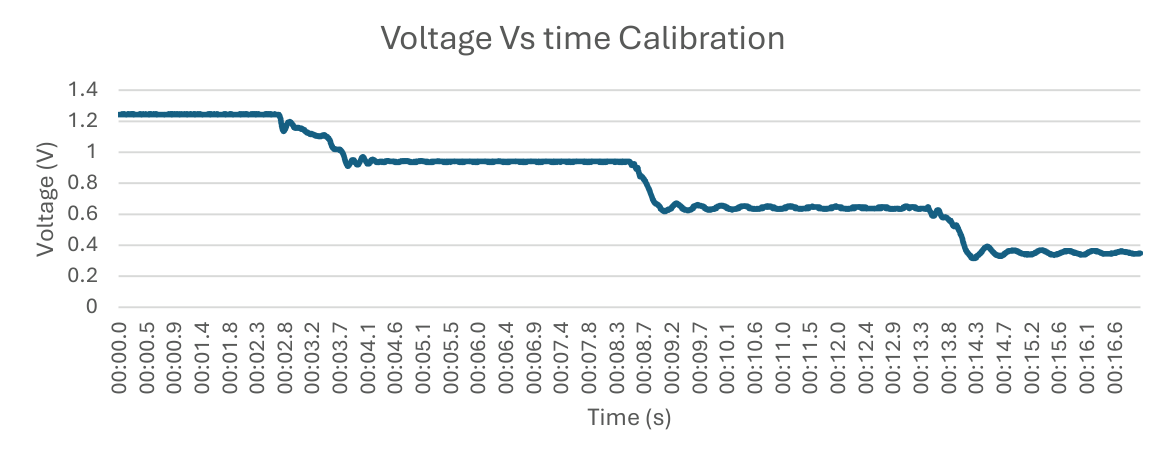
A strain-gage load cell was built from an aluminum cantilever beam instrumented in a half-bridge configuration. Known masses of 1, 2, and 3 kg were hung from the motor clamp end and the stable voltage plateau at each load was recorded. A linear fit to the four voltage-force pairs (including zero) produced the calibration equation that converts any measured voltage to force:
F = 32.931 × V − 40.732 (N)
This equation was applied to all subsequent voltage-time recordings to produce thrust-time curves. Total impulse was computed by trapezoidal integration of the thrust curve, and average thrust as It / tb. Each motor was mounted with its nozzle pointing downward, an igniter inserted with a color-coded plug, and the launch controller armed. Data acquisition ran ~3 seconds before ignition to capture the pre-fire baseline for subtraction.

Live Firing Footage
Live recording of a solid rocket motor firing during the outdoor test session. The sharp ignition spike, sustained thrust plateau, and abrupt burnout visible in the thrust curves are all apparent in real time.
Key Results
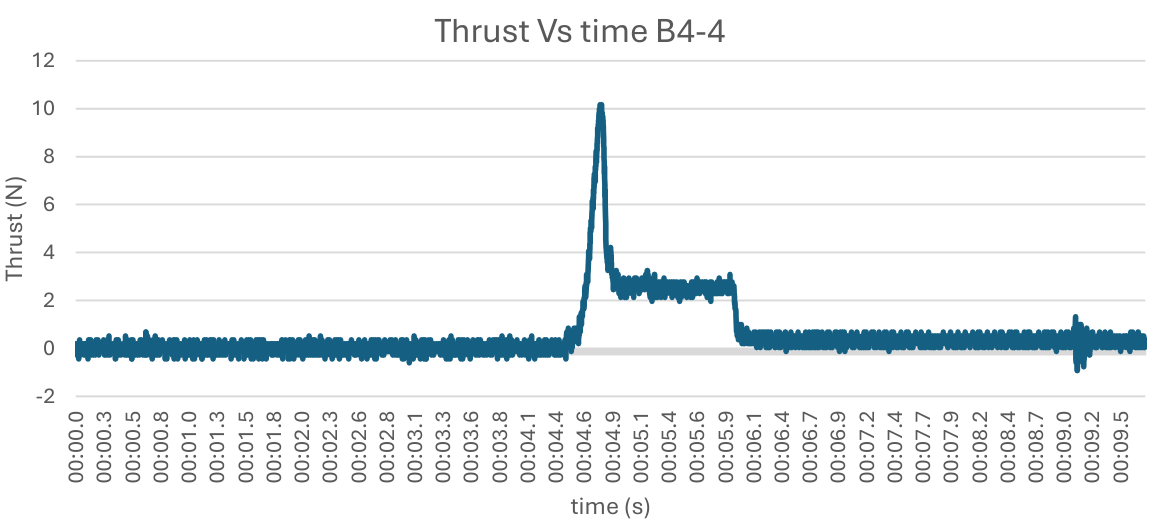
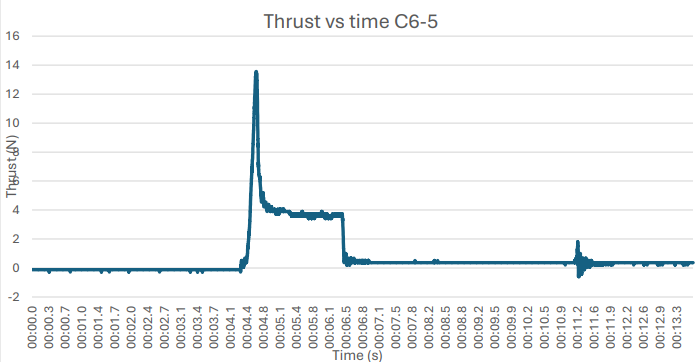
All five motors showed the characteristic black-powder thrust profile: a sharp ignition spike, a sustained plateau, and a sharp burnout. The C6-5 was selected for detailed analysis:
| Parameter | Measured | Estes Spec | % Diff |
|---|---|---|---|
| Peak thrust (N) | 13.55 | 15.3 | 12.1% |
| Burn time (s) | 2.1 | 1.6 | 27.0% |
| Total impulse (N·s) | 8.53 | 10.0 | 15.9% |
| Delay time (s) | 4.8 | 5.0 | 4.1% |
- The 27% burn time deviation was the largest discrepancy, attributed to ignition delays, beam damping from the oil-bath dashpot, and manufacturing tolerances in hobby-grade motors.
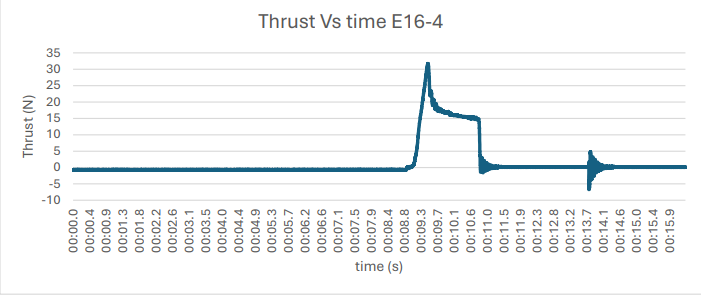
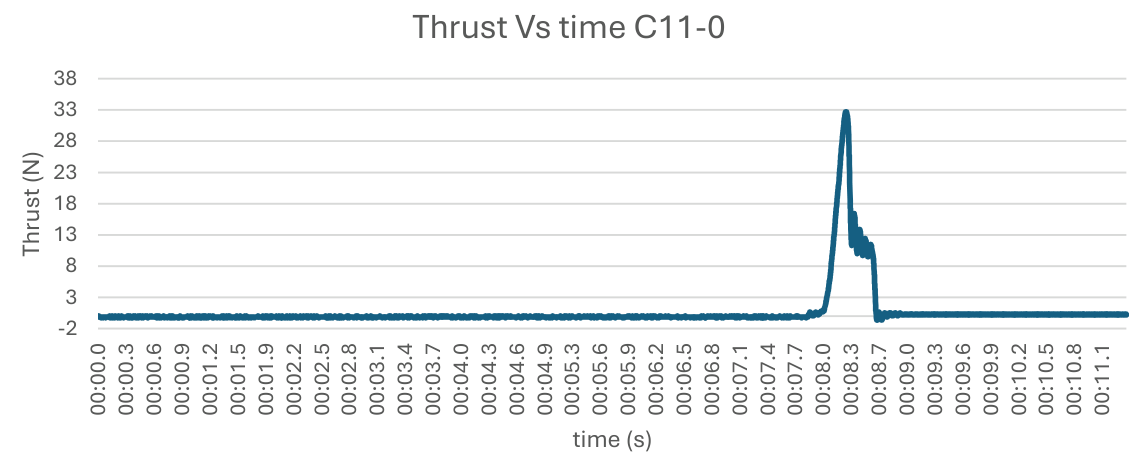
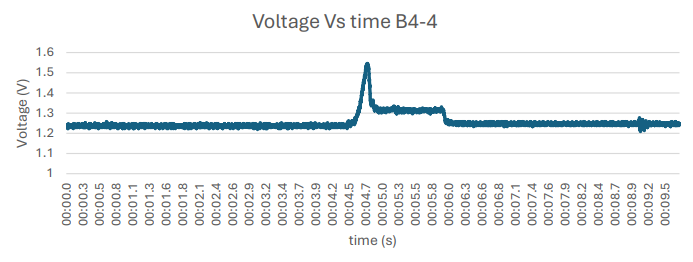
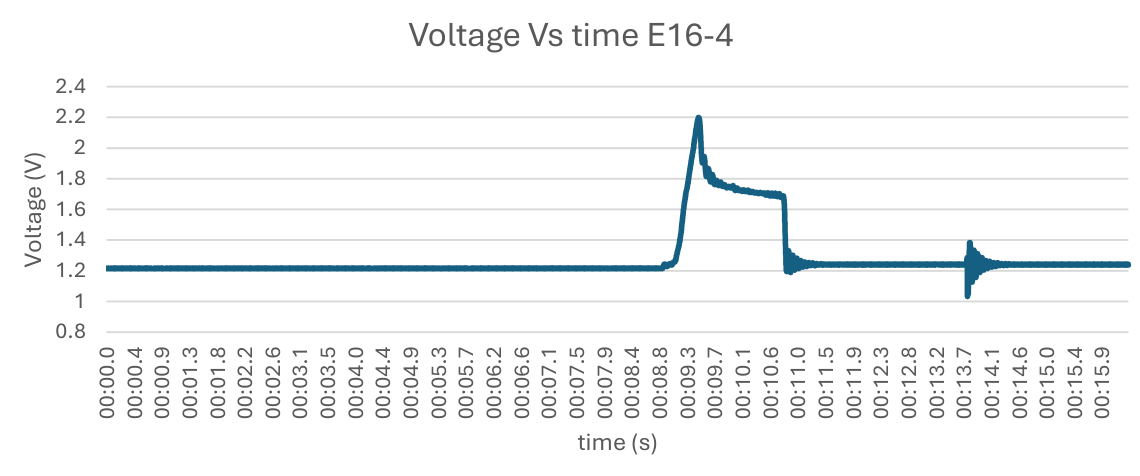
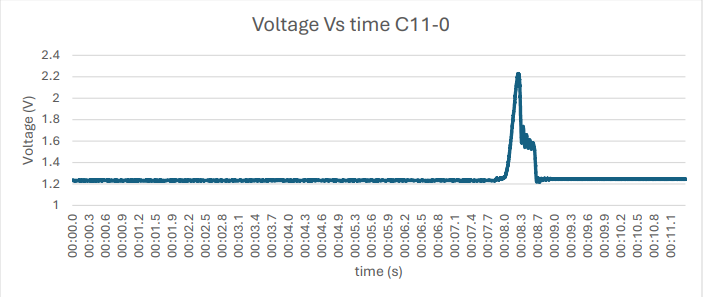
- Higher impulse class motors (C11-0, E16-4) produced peak thrusts of ~30 N with characteristic sharp ignition spikes visible in their voltage traces.
Valuable Takeaways
- Static calibration is the foundation of any force measurement system. The voltage-to-force conversion derived from known masses is what made every subsequent thrust reading meaningful. A poorly calibrated load cell produces data that looks precise but is systematically wrong — a critical lesson for any instrumentation role.
- Real motors deviate from specifications, and that deviation matters. A 27% burn time error means a vehicle reaches altitude 27% later than planned — the kind of discrepancy that drives test-before-fly requirements in professional propulsion programs, from CubeSat kick stages to large solid rocket boosters.
- The thrust curve encodes everything about a propulsion system. Area under the curve is impulse; shape determines vehicle dynamics; peak loads size the structure. Learning to read and extract parameters from thrust curves is a core skill in propulsion engineering.
- Gained end-to-end experience in instrumentation design: from calibration curve derivation and outdoor live-fire data acquisition, through TracerDAQ signal processing, to propulsion parameter extraction and comparison against manufacturer specifications.
Voltage vs. Time Results
Raw strain-gage voltage output recorded during each motor firing. The calibration test confirmed the linear voltage-to-force relationship. All five motors produced clear ignition spikes followed by a sustained plateau and a sharp burnout, consistent with black-powder propellant combustion behavior.
Thrust vs. Time Results
Voltage traces converted to thrust (N) using the calibration equation F = 32.931×V − 40.732. Peak thrust, average thrust, burn time, and total impulse were extracted from each curve. The C6-5 was selected for comparison against Estes manufacturer specifications.